Tyrah Cobb-Davis (she/her)

Master's Student | Geography and Environmental Systems
University of Maryland, Baltimore County
View My LinkedIn Profile
Sewage Overflows and the Relation to Heavy Rainfall Events
Project description:
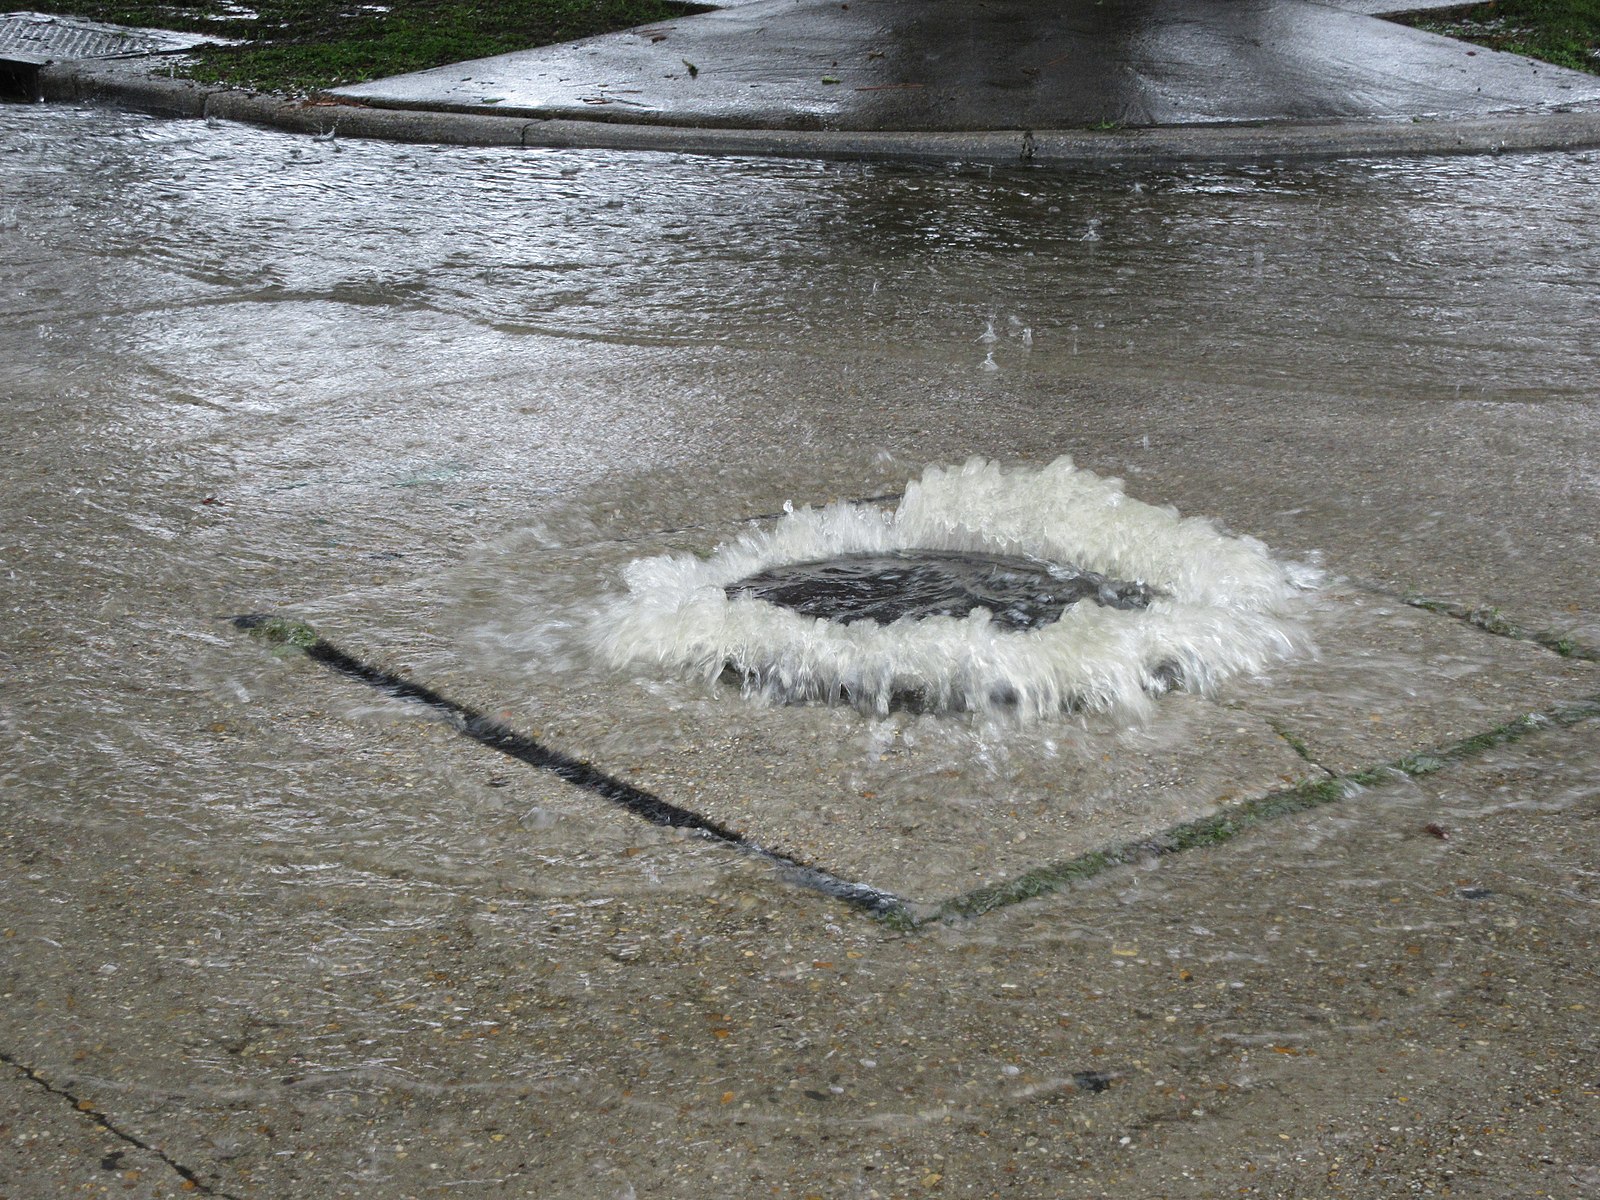
Climate change is a continued growing area of concern for many people. One common example relates to increased and more frequent rain events. My research focuses on exploring the question of where flooding events are likely to occur in the Baltimore area by assessing 311 reports, rainfall data, and the urban drainage system. Baltimore City has a separate sewer system, meaning that rainwater and sewage water are diverted using different pipes. In a combined sewer system, the rainwater and sewage are collected together. A sewage overflow is when there is a lot of rainwater that enters the sewer lines, causing an overflow of polluted waters into local water systems. According to Szeląg et al (2021), these sewer floods are happening more often. The amount of sewage discharged into these local water sources can be very high. For example, it was reported by the Baltimore City Department of Public Works that 45 million gallons of mixed sewage and rainwater occurred between July 21 and July 25 (DPW source). In my final project I hope to make a connection between known reports of sewage overflows and instances of rainfall. Although my primary focus is not on water quality, it is important to understand the relationship between the two because more sewage overflows means that there is a greater chance of pollution entering the stream and river system.
I wanted to see if there was a correlation between the number of sewage overflow reports and the amount of rainfall in Baltimore City.
Data
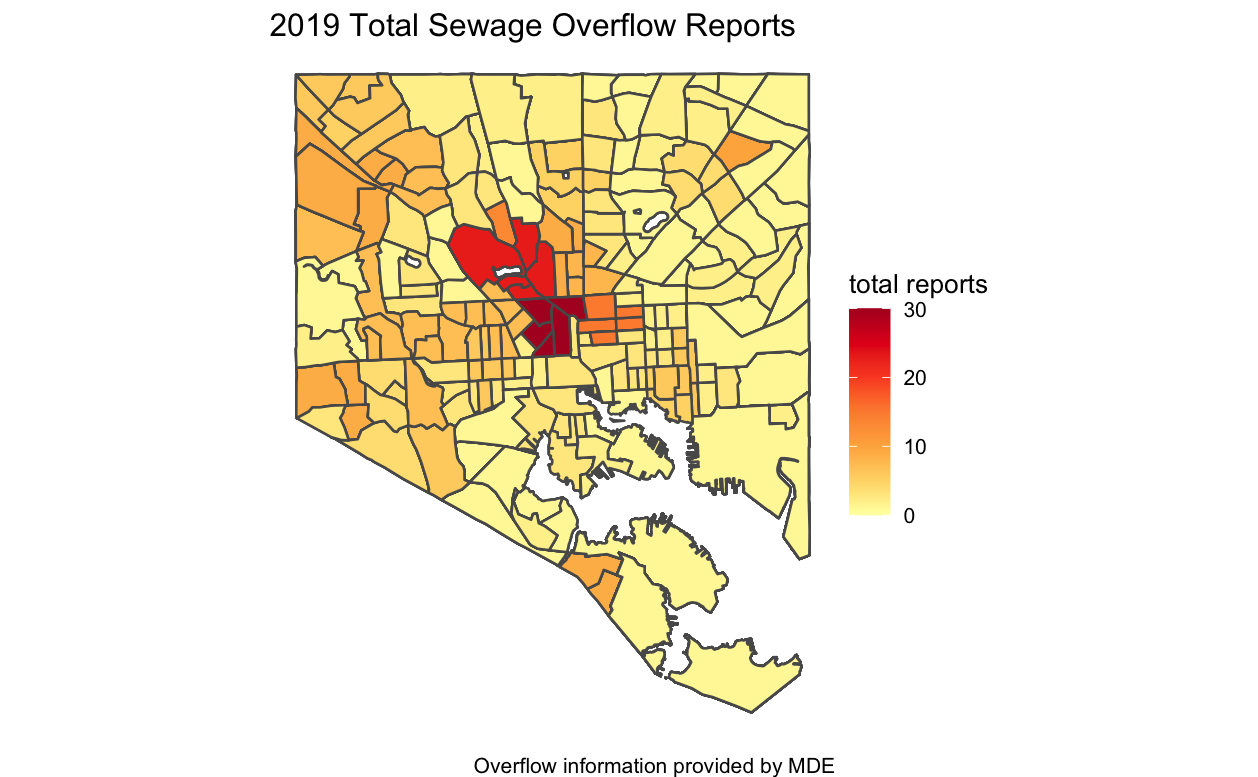
Showing the report distribution when thinking about the city as hexagons.

I used data from the Maryland Department of the Environment to find sewage overflow reports for Baltimore City, specifically from the year 2019.
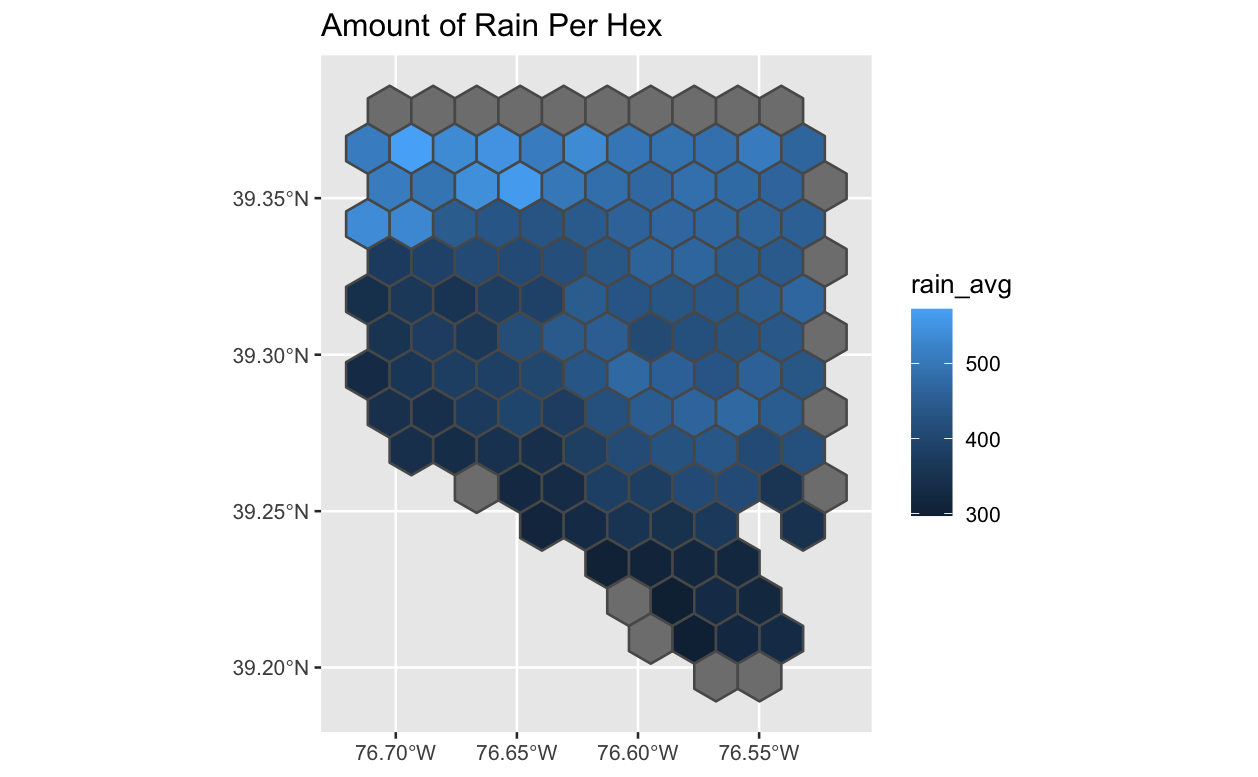
Showing the rainfall distribution across the city. This was a better way to analyze the data before eventually relating it to the census tracts because the rain data was provided in 242 pixels, with a centroid withiin each circle.
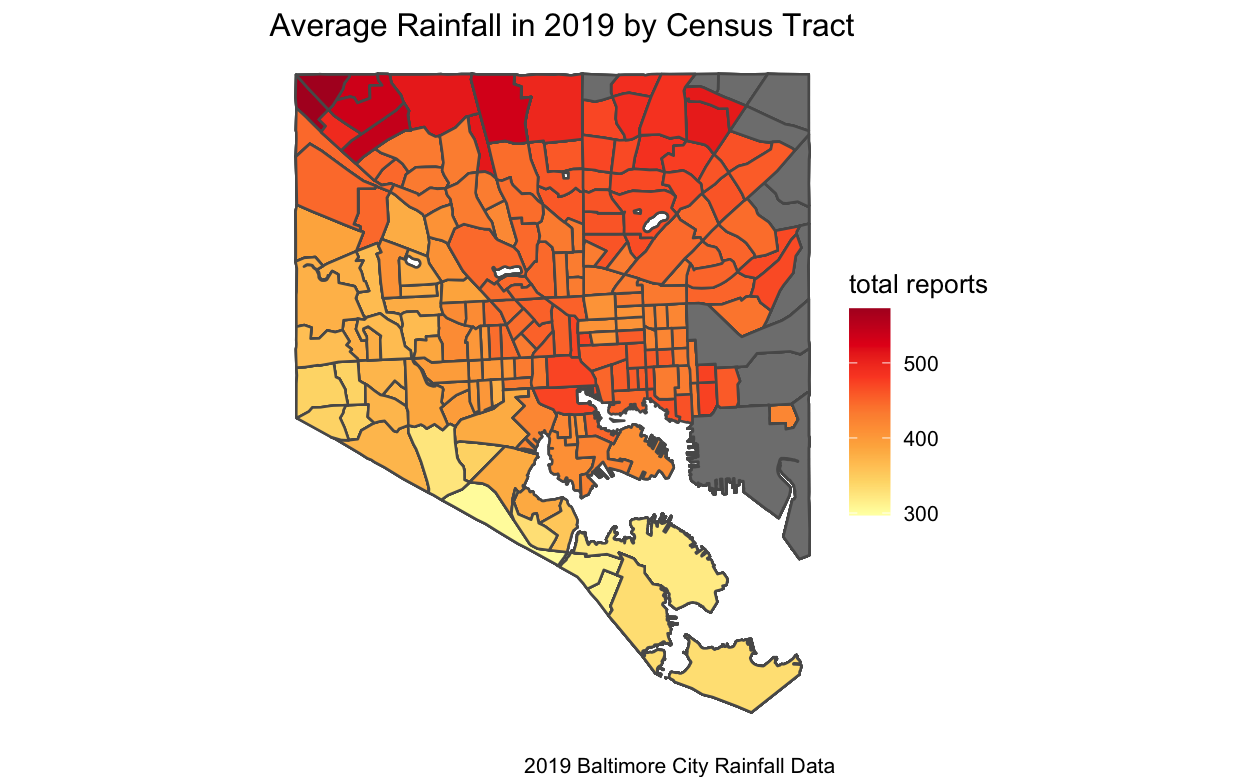
Showing the rainfall distribution across the census tracts.
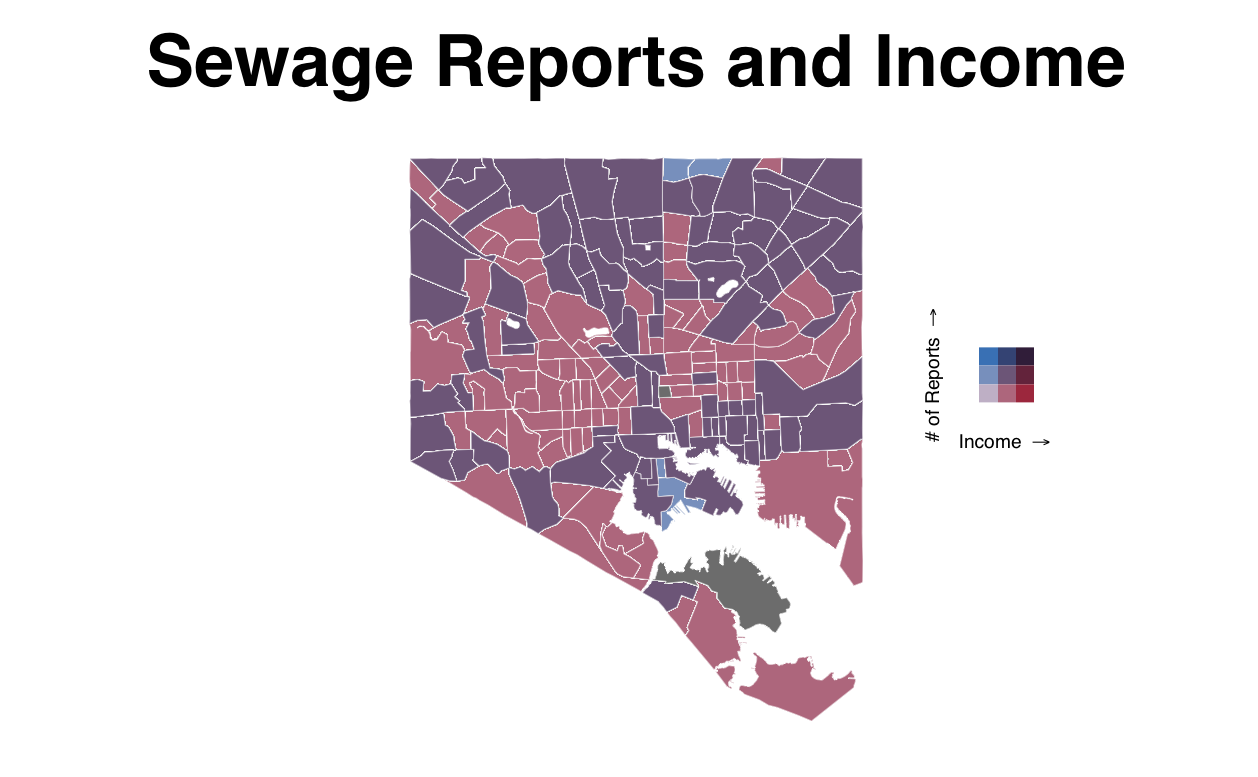
Showing the income and sewage reports. There is this idea that lower income communities do not have the resources or care to reach out to local municipalities for assistance because they feel like they will be ignored and overlooked more so than the more affluent communities that the city allocates a lot of resources to.
The map shows how income and submitted reports are correlated.
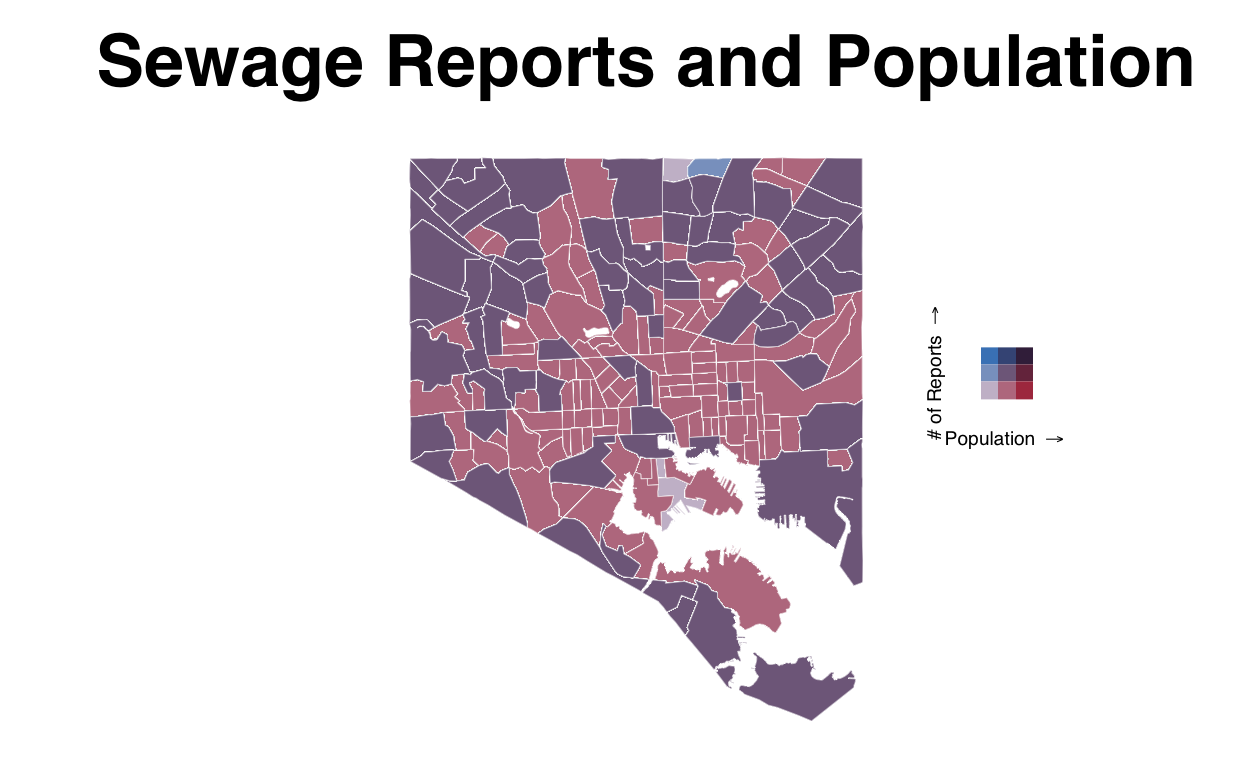
Showing how population relates to the number of sewage reports. Here we can kind of see the pattern of “the Black Butterfly and the White L.”
The map shows how population and submitted reports are correlated. Would we expect for more populated areas to have more reports?
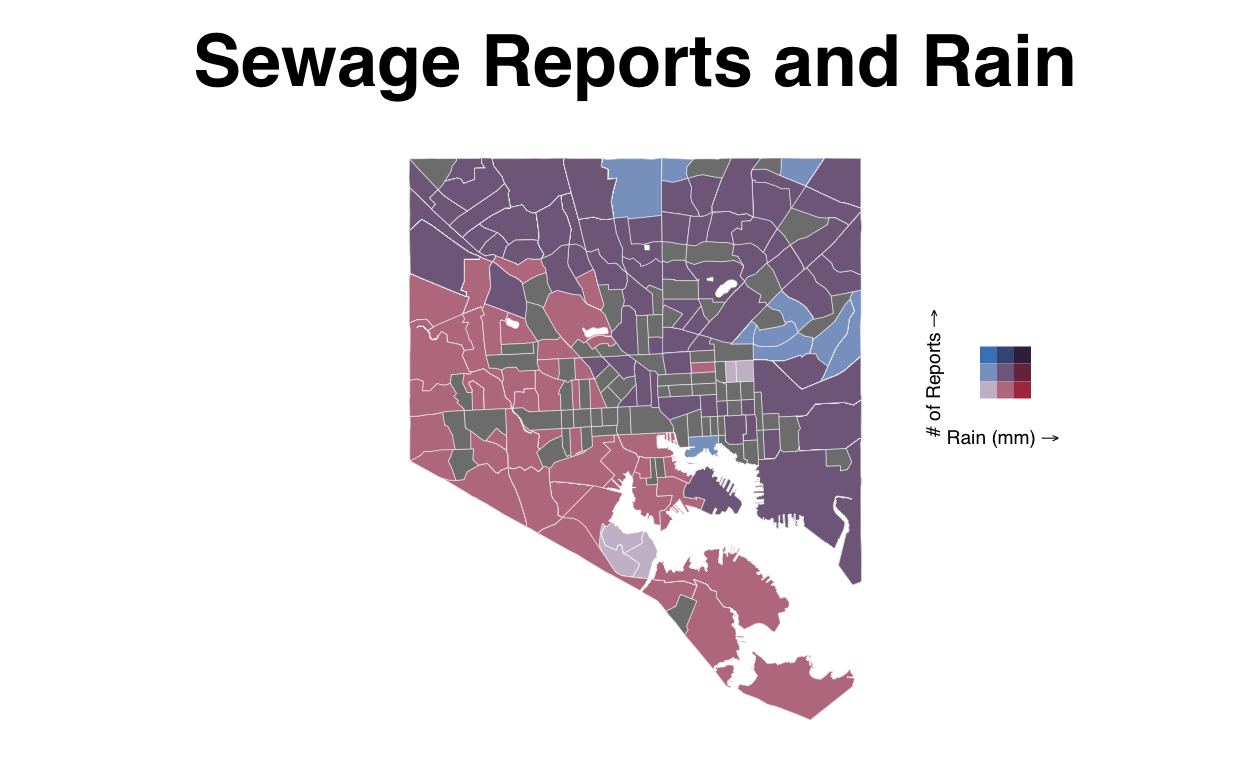
Showing how rainfall distrubtion compares to the number of submitted sewage overflow reports in 2019.
The map shows how population and submitted reports are correlated. Would we expect for more populated areas to have more reports?
See full coding and other graphs here